
A journey into the Linux proc filesystem
And how you can gleam a wealth of information about system from it

I am currently unemployed so I like to spend my free time learning and exploring new things. After I got past my initial anxiety of what the hell I should learn out of the sea of possibilities, I decided to take some time and go deep into container runtimes, containers from scratch and other bits and bobs that I took for granted in my career thanks to all the wonderful abstractions that are build on top like docker, Kubernetes and other useful tools.
One of the wonderful things about going deep into any topic is that if you are curious enough, you end up taking detours down rabbit holes that teach you other things along the way, so that’s how I ended up writing this about the proc filesystem, something I had already mostly forgotten about.
This article is barely touching the surface on how much info you can dig out of the proc filesystem but it serves as a good introduction to what it does and the things you can get out of it with some simple scripting, even if you don’t have tools like htop, ps, top, etc.
It also serves me as a public notepad so I don’t forget in the future :-)
What is the /proc folder in Linux?
In the man page, the proc folder is described as such:
The proc filesystem is a pseudo-filesystem which provides an interface to kernel data structures.
What that essentially means is that it is a way for tools like ps and others to query data about kernel and processes, including their pid, user, current working directory, memory, etc.
In other words, information displayed within /proc is dynamically generated by the kernel and reflects the current state of the system. The /proc directory location is convention, but you could potentially mount it anywhere:
# Mounts a proc filesystem in arbitrary folder
# Only do this on a test VM
mkdir arbitrary-folder
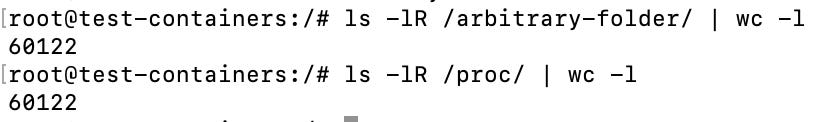
mount --type proc proc-mount-name /arbitrary-folderAfter running the command above you will have two identical directories where the proc filesystem is mounted and the kernel dumps information to both of them, counting the number of files in each directory yields the same result:
We can now unmount the /arbitrary-folder we created
umount /arbitrary-folder/It’s worth noting that if we were to get rid of /proc folder and kept only /arbitrary-folder many of our applications, such as top or ps would not work as they look for information in this directory.
Two main areas
One way you can understand the proc filesystem a little better is by diving it into two areas:
General kernel information that is found under /proc, this includes stuff like
/proc/versionwhich you can cat use to view your kernel version (similar to runninguname -a)Information found under the numbered folders under
/proc. Each number represents a parent or child process with their threads located under/proc/[pid]/task
In this post I am mainly dumping the things the I found interesting and useful to know as I was poking around but there is far more you can get from the man page
Why learn about the proc filesystem?
Aside from a great learning experience, it’s also great to know if for any reason you don’t have access to tools like ps or top. You can get almost any information about processes or the kernel just by digging around this directory and using a bit of scripting - provided that you have permissions to do so.
For example, imagine you fetched and ran the httpd container image like so:
docker run -it --rm httpd shAnd then you wanted to get a list of processes:
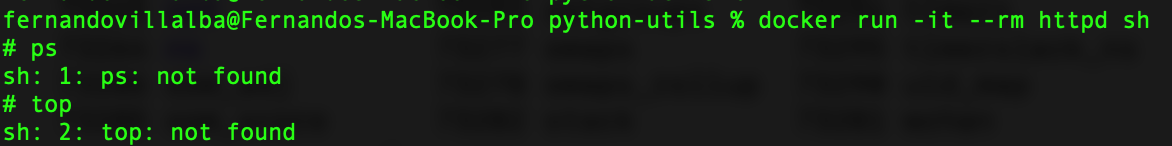

In this article you will learn that as long as the proc filesystem is mounted in your container, you will be able to access this information, even without these commands, which may came in handy some day, and if not, at least it’s great to learn!
Digging out process information
So with that in mind, let’s poke a bit around the /proc directory to see what sort of information we can get from it. For simplicity’s sake, I kept all these commands as a one-liner
Listing all processes and their executable files
for proc in /proc/[0-9]*; do echo "$(basename $proc) --> $(readlink $proc/exe)" ; doneThis loops over all the numbered folders in the proc directory that correspond to a process and then gets the address of the symlink for the file exe, yielding the following:
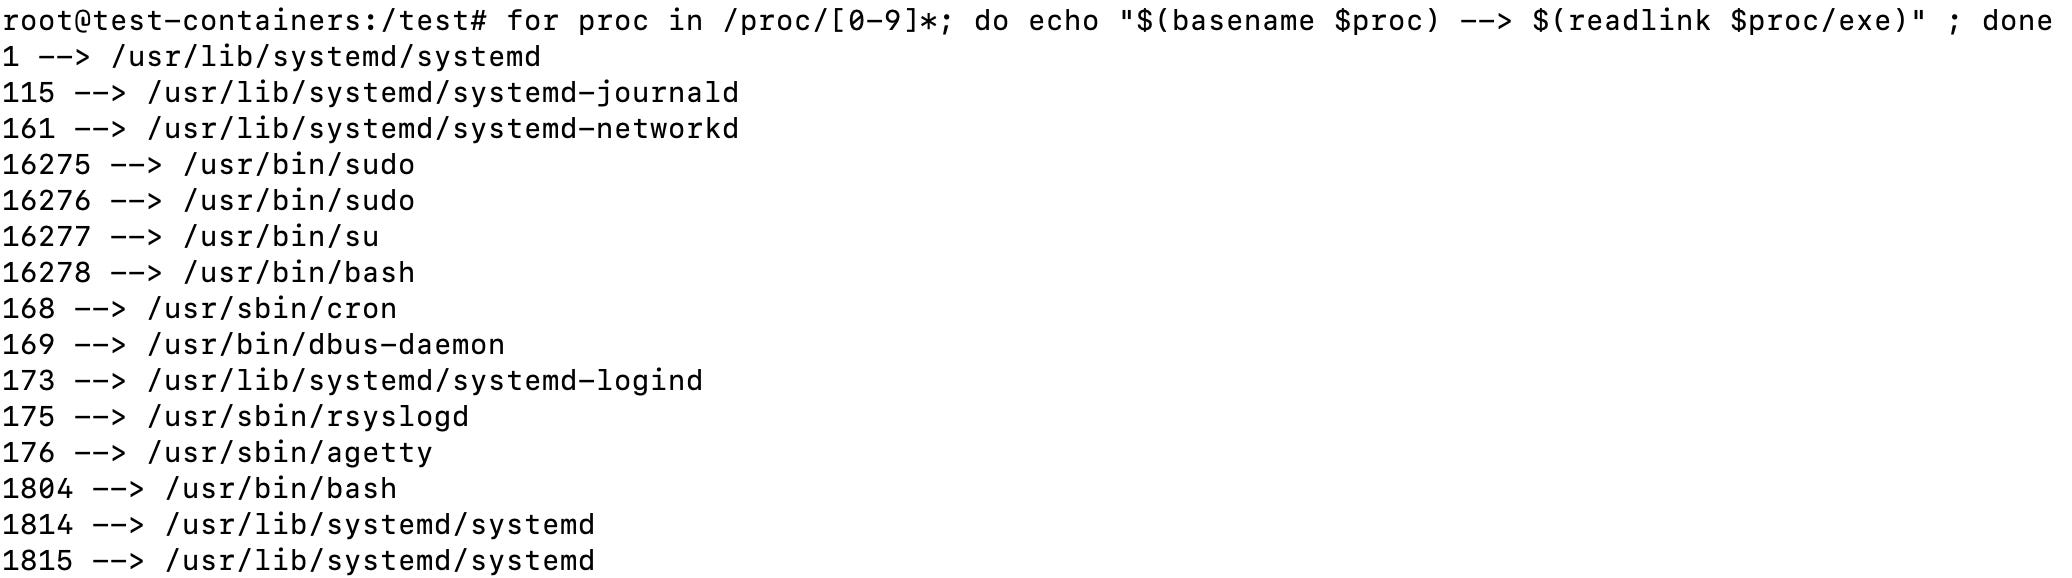
It’s worth noting that this and the majority of the commands here only show parent and forked child processes, they do NOT show threads. Threads share the memory space of the parent process and they are found in the /proc/[pid]/task folder
Show the threads of every process
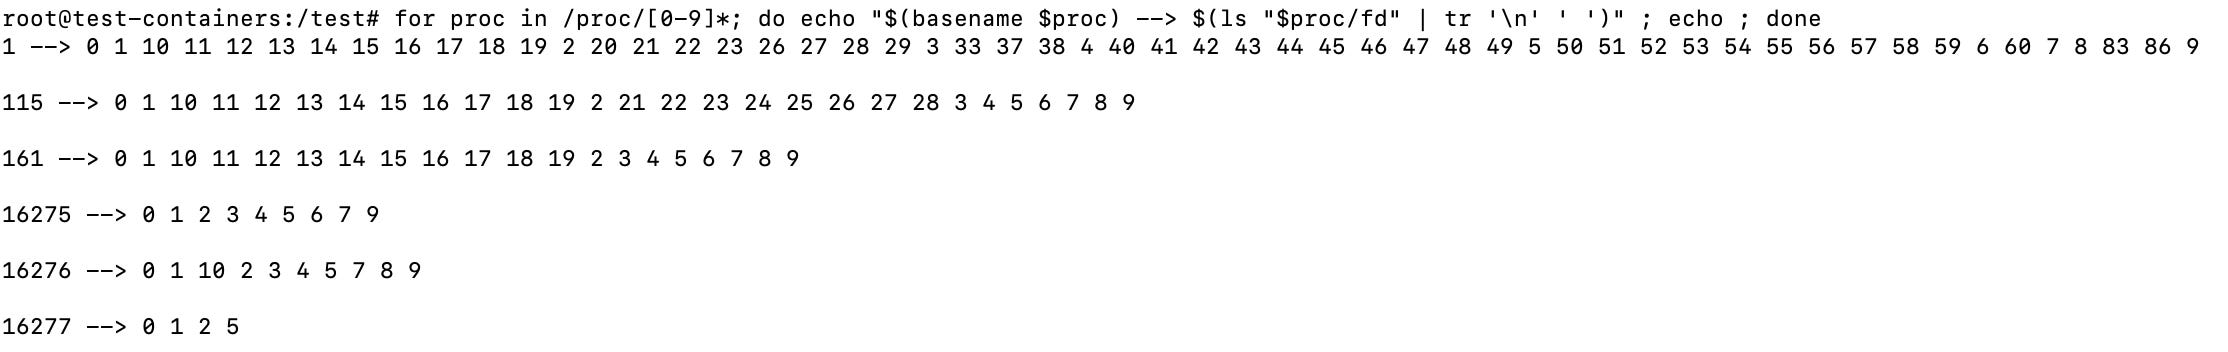
So in order to show the thread ids (tids) we can run the following command:
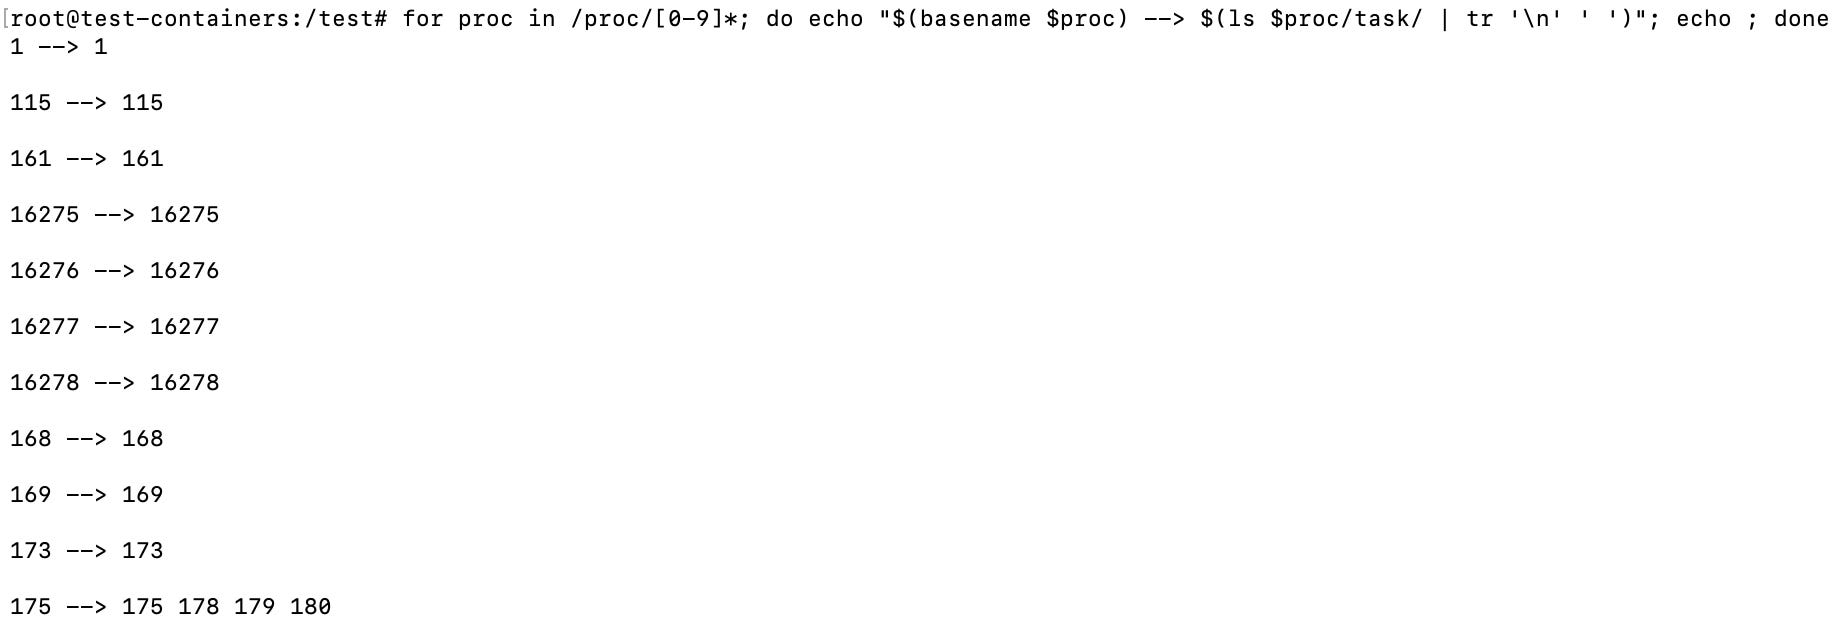
for proc in /proc/[0-9]*; do echo "$(basename $proc) --> $(ls $proc/task/ | tr '\n' ' ')"; echo ; doneThis shows all the thread processes folders found under the /proc/pid/task, if the process has no sub-threads, it will just contain the parent process id (pid), the above yields the following:
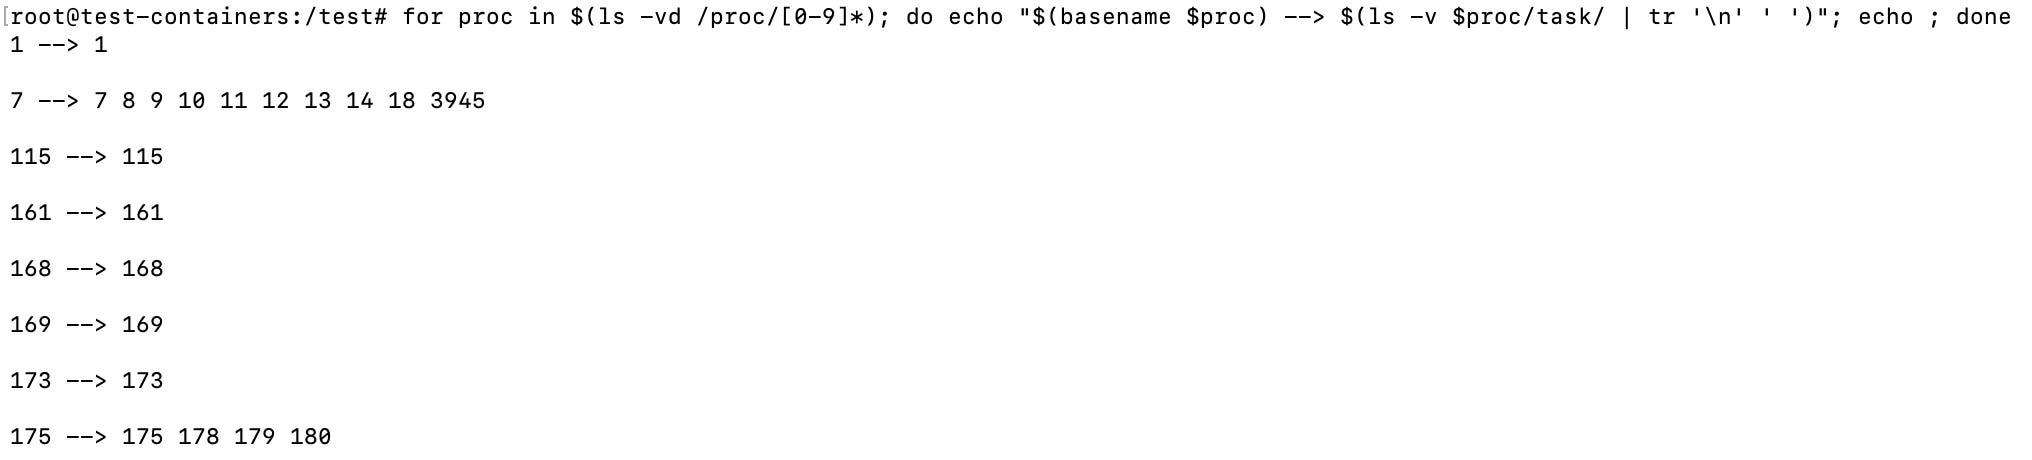
If you want to get this same information but organized by numerical values you can use ls -vd to loop over the folders like so:
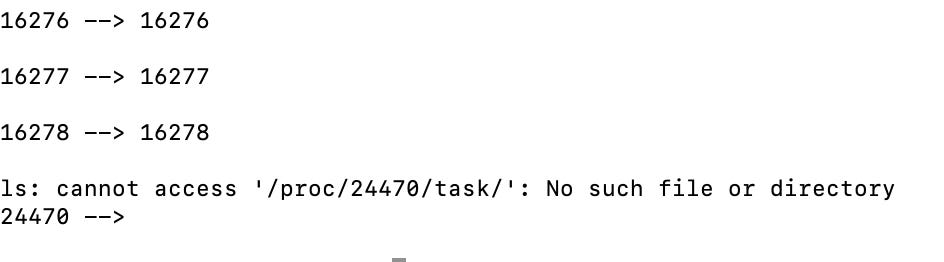
for proc in $(ls -vd /proc/[0-9]*); do echo "$(basename $proc) --> $(ls -v $proc/task/ | tr '\n' ' ')"; echo ; doneAlthough that will give you a minor error for the last ls execution which won’t be found within the task folder after the process stops, it serves to illustrate the dynamic nature of the proc filesystem:
…
Let’s now look at the same information with htop, If we set it up to enable tree view by pressing F2, we get the following:
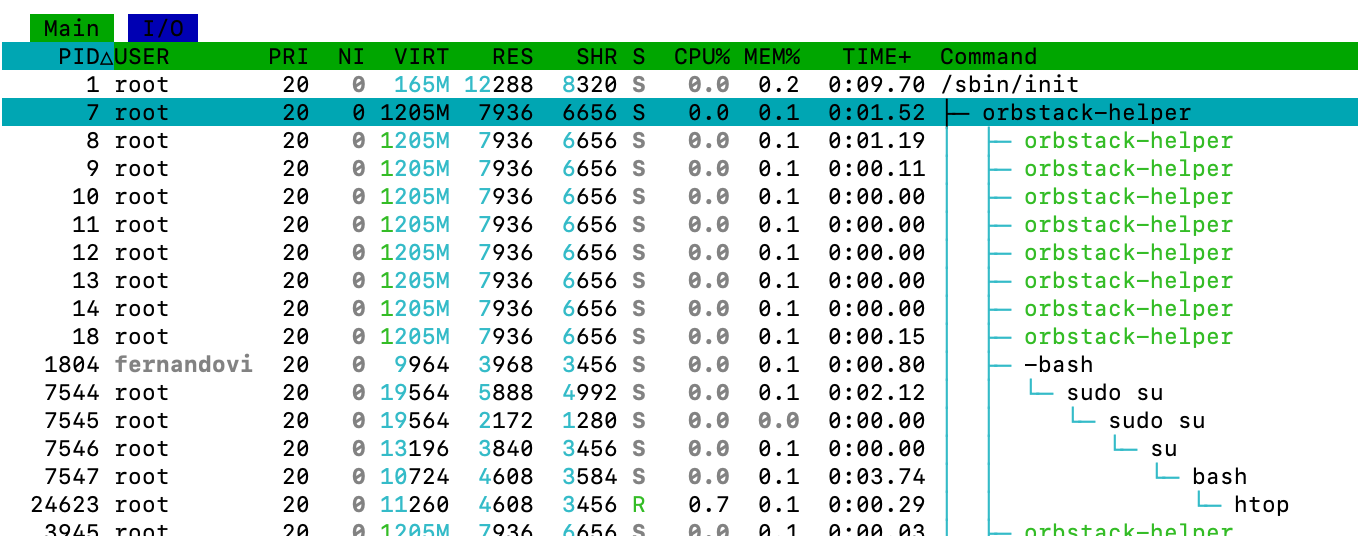
You can see that process 7 has threads, 8, 9, 10 and so on… htop shows threads as green and child processes as the same colour as the parent process.
Showing the command and arguments
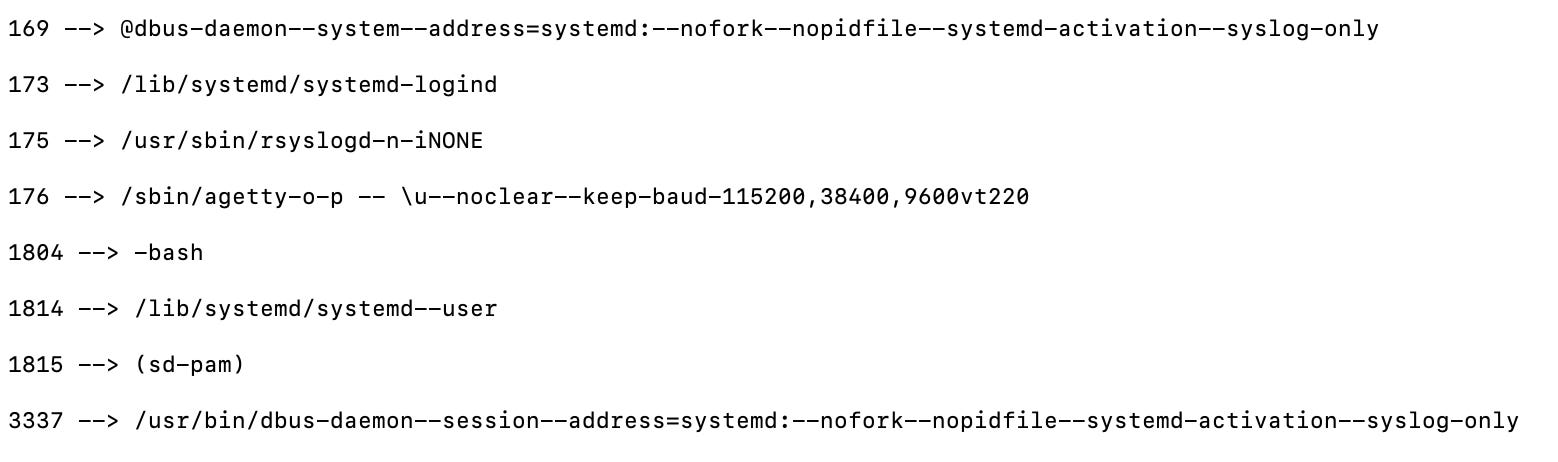
This will show the process and arguments that were used to run this process:
for proc in /proc/[0-9]*; do echo "$(basename $proc) --> $(cat "$proc/cmdline" | tr -d '\0')" ; echo ; doneThis being the result:
…
…
Show the environment variables that a process is using
To show the environment variables a process is using you can do the following:
for proc in /proc/[0-9]*; do echo "$(basename $proc) --> $(cat "$proc/environ" | tr -d '\0')" ; echo ; doneWhich will yield the following result:
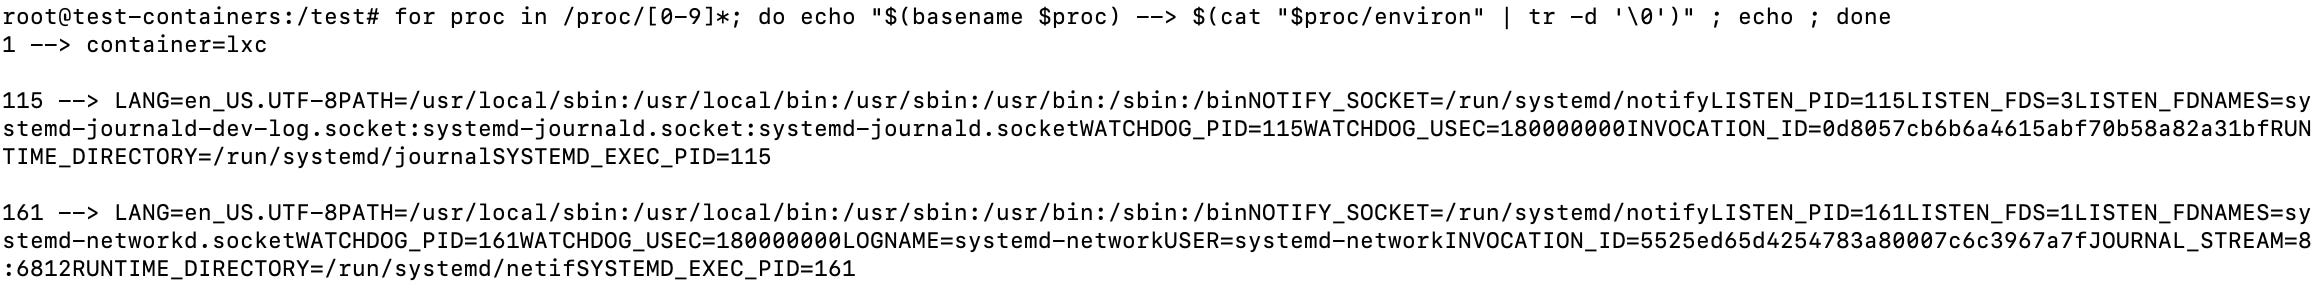
This command in particular would be very useful to diagnose a 12 factor app and ensure all the settings are correct.
Check the current working directory of a process
This will show you on which directory the current process is operating.
for proc in /proc/[0-9]*; do echo "$(basename $proc) --> $(readlink $proc/cwd)" ; done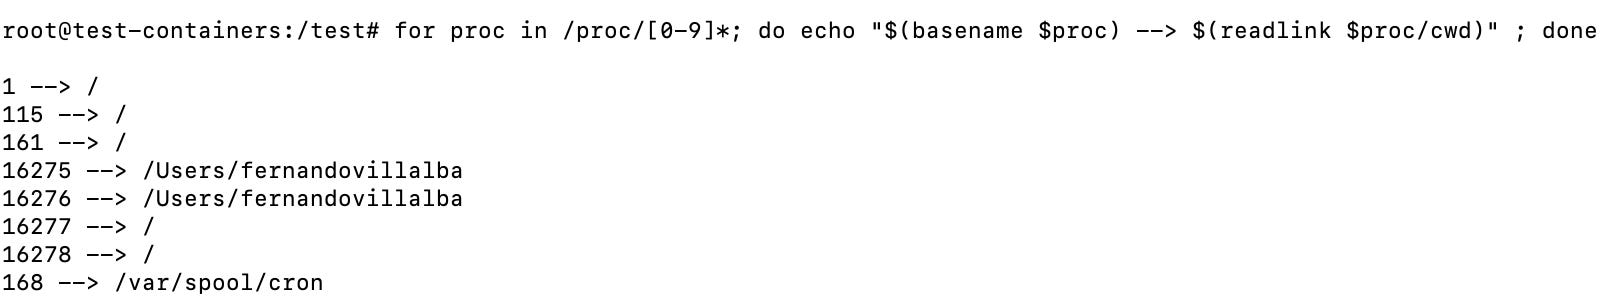
Here is another way to see it in action is by running echo $(readlink /proc/$$/cwd):
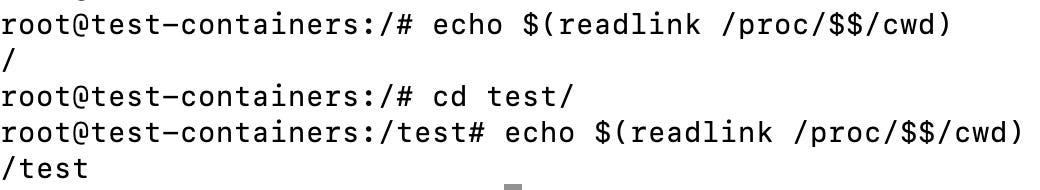
As you can see, checking where the symlink points to changes when we move around in the shell.
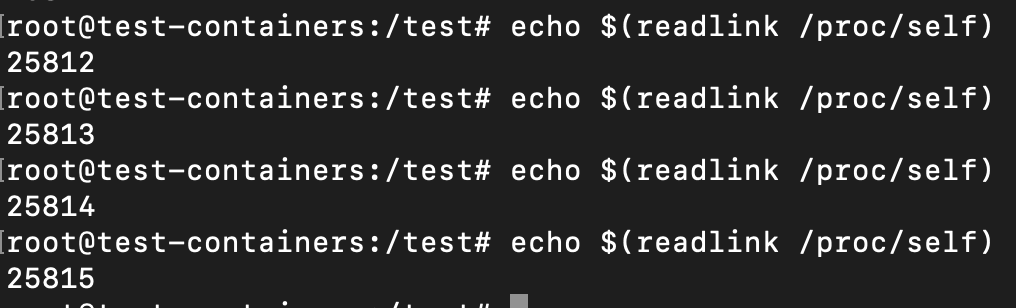
The self and thread-self symlink
Above we used $$ which returns the pid of the shell. So the above command gave us information about out current shell. One may be distracted and think that this is the same:
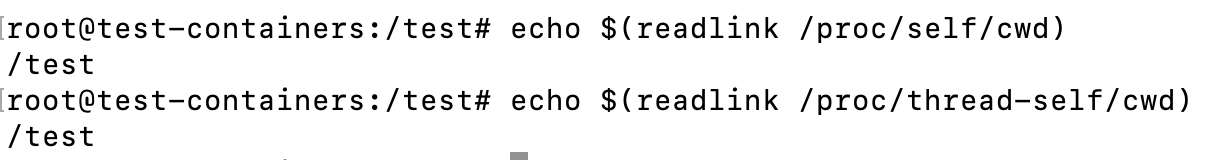
These two path are mapped as followed:
/proc/self—>/proc/[process-accessing-id](self will dynamically change location to point to the pid of the process accessing it)/proc/thread-self—>/proc/[process-accessing-id]/task/[thread-accessing-id](ditto)
So in out above example self would change to reflect the process id of readlink as shown below:
Check all the file descriptors open by each process
This will show you how many file descriptors each process has open.
for proc in /proc/[0-9]*; do echo "$(basename $proc) --> $(ls "$proc/fd" | tr '\n' ' ')" ; echo ; done
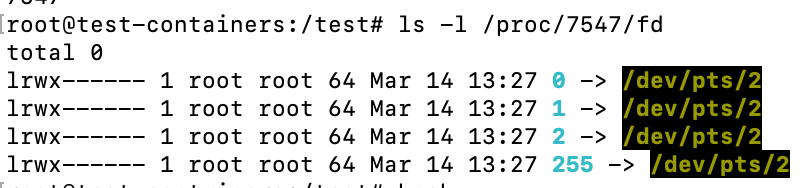
An interesting thing to do here is listing the /proc/[pid]/pd directory, for example:
ls -l /proc/1/fd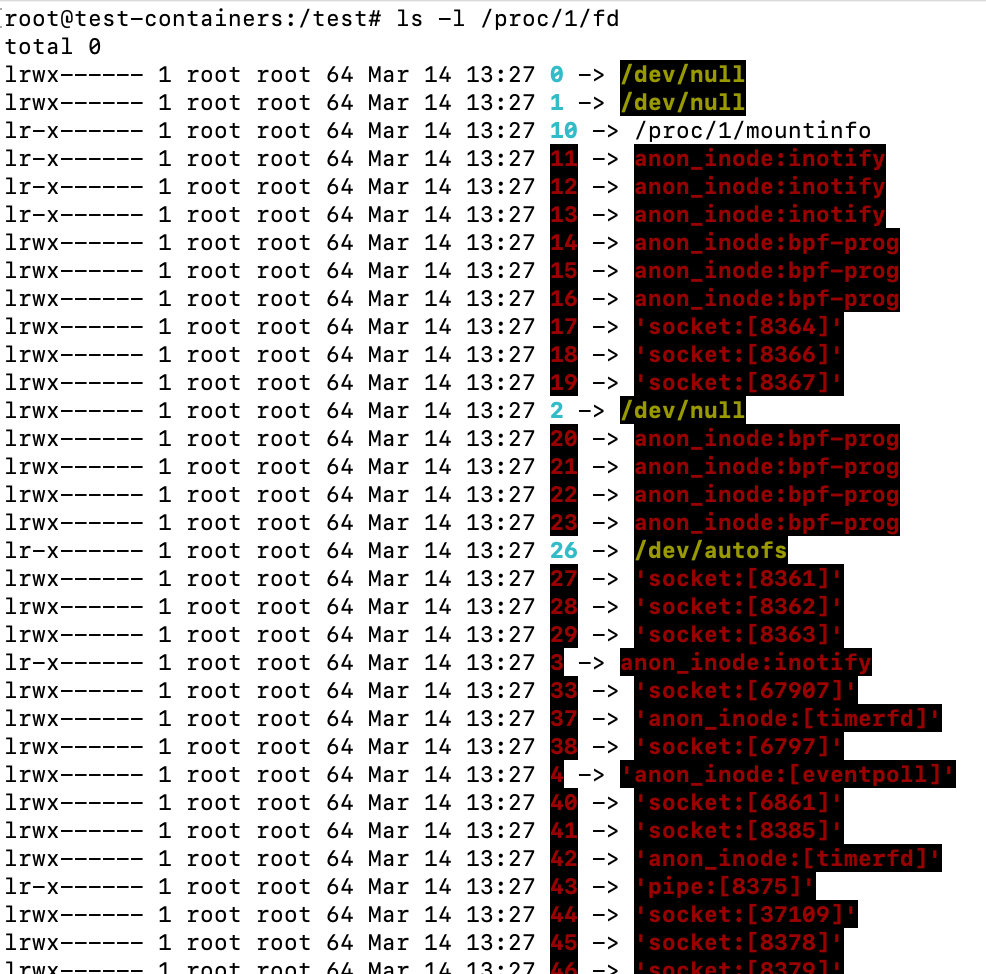
This will give you an idea of the file descriptors the process has opened and where they point to. You can see that the init process sends all it’s standard input (0) standard output (1) and standard error (2) to /dev/null. And in the case of the bash process below, they are sent to /dev/pts/2, which is the pseudo-terminal (where the user types):
Find out user and group of the processes
You can also easily find out the owner user and group of a process simply by checking the ownership of the pid directories like so:
for proc in /proc/[0-9]*; do echo "$(basename $proc) --> $(stat -c '%U:%G' $proc)" ; doneThis yields the following result:
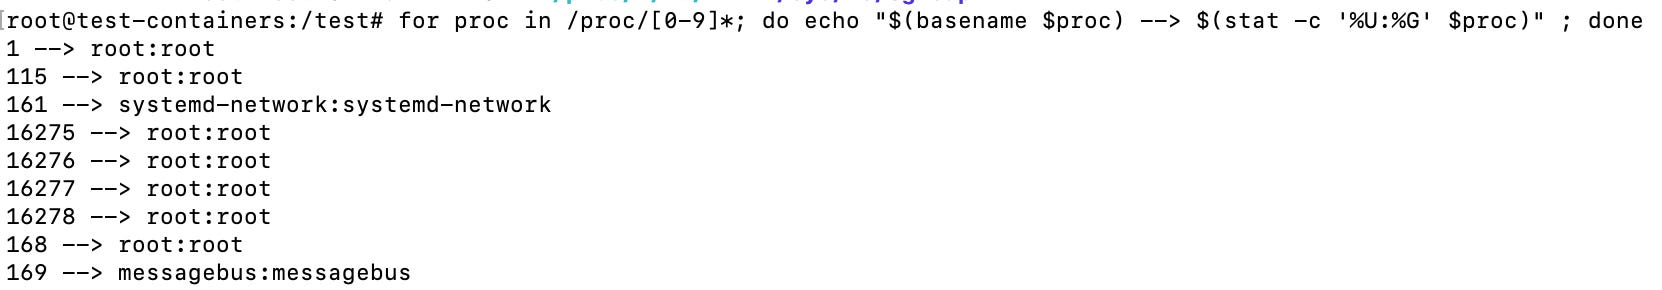
This also means that you won’t have access to view details of files you don’t own, unless you are root.
Find out the filesystem mounts a process is using
You can also check what filesystems a process has mounted, for example to see what filesystem the current instance of your terminal has mounted run the following command:
cat /proc/$$/mountinfo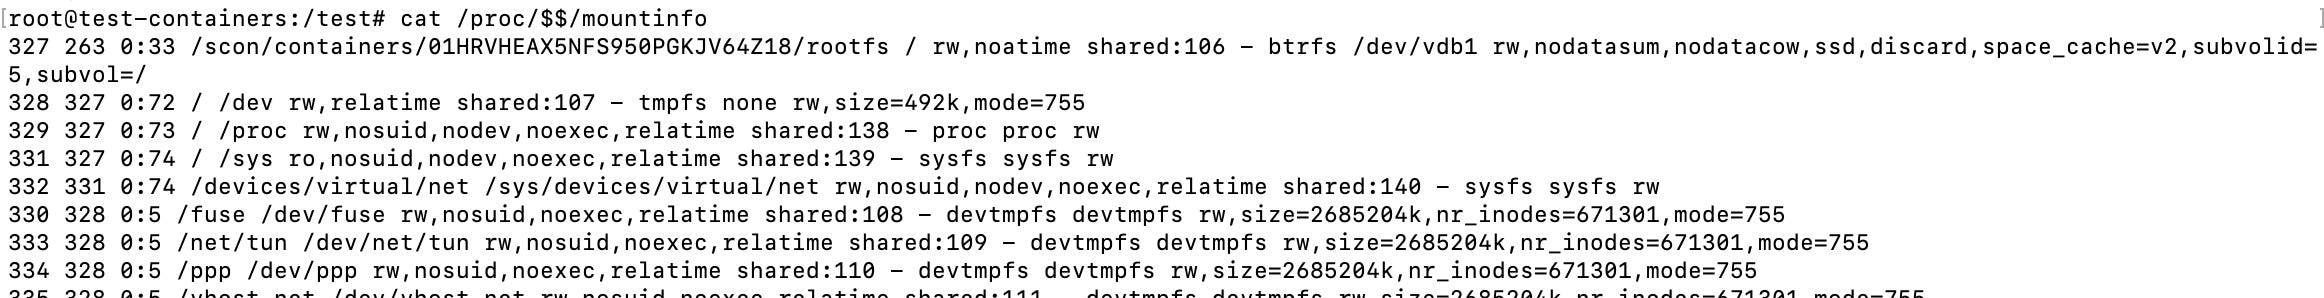
The stat file
If you cat the stat file under /proc/[pid]/stat you will get what looks like a bunch of nonsensical numbers:
cat /proc/$$/stat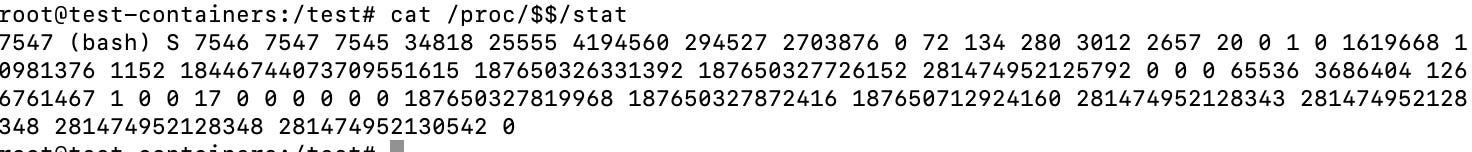
Each of these 52 items are crucial for tools like top, ps and others to get information about a process, you can find what each means in great detail on the man page but here is a quick description of all of the above fields:
PID (Process ID): 7547Comm (Command name): bashState (Process state): SPPid (Parent process ID): 7546Pgrp (Process group ID): 7547Session (Session ID): 7545TtyNr (Controlling terminal): 34818TPGid (ID of terminal process group): 25555Flags (Kernel flags): 4194560Minflt (Minor faults): 294527Cminflt (Minor faults with child's): 2703876Majflt (Major faults): 0Cmajflt (Major faults with child's): 72Utime (User mode CPU time): 134Stime (Kernel mode CPU time): 280Cutime (User mode CPU time with children): 3012Cstime (Kernel mode CPU time with children): 2657Priority (Priority): 20Nice (Nice value): 0NumThreads (Number of threads): 1Itrealvalue (Time in jiffies before next SIGALRM): 0StartTime (Time the process started in jiffies): 1619668Vsize (Virtual memory size): 10981376Rss (Resident Set Size): 1152Rsslim (Limit in bytes of rss): 18446744073709551615StartCode (Address above which program text can run): 187650326331392EndCode (Address below which program text can run): 187650327726152StartStack (Address of the start of the stack): 281474952125792Kstkesp (Current value of ESP - stack pointer): 0Kstkeip (Current value of EIP - instruction pointer): 0Signal (Bitmap of pending signals): 65536Blocked (Bitmap of blocked signals): 3686404Sigignore (Bitmap of ignored signals): 1266761467Sigcatch (Bitmap of caught signals): 1Wchan (Address of the kernel function): 0Nswap (Number of pages swapped): 0Cnswap (Cumulative nswap for child processes): 0ExitSignal (Signal to be sent to parent process): 17Processor (CPU number last executed on): 0RtPriority (Real-time scheduling priority): 0Policy (Scheduling policy): 0DelayacctBlkioTicks (Delayed block I/O wait time): 0GuestTime (Guest time of the process): 0CguestTime (Guest time of the process's children): 0StartData (Address above which program data - heap): 187650327819968EndData (Address below which program data - heap): 187650327872416StartBrk (Address above which program initialized and uninitialized data - BSS - are placed): 187650712924160ArgStart (Address above which program command-line arguments - argv - are placed): 281474952128343ArgEnd (Address below program command-line arguments - argv): 281474952128348EnvStart (Address above program environment variables - envp - are placed): 281474952128348EnvEnd (Address below program environment variables - envp): 281474952130542ExitCode (The thread's exit status in the form reported by waitpid): 0
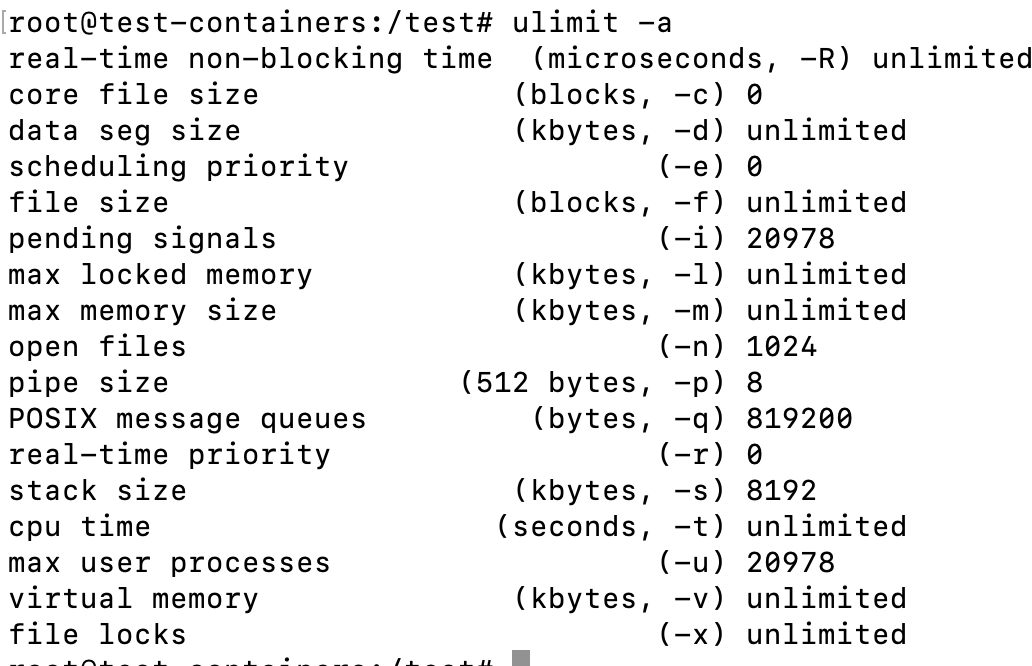
Find the limits of a process
If you wanted to see the limits of the init process you can do the following
cat /proc/1/limitsThis will yield the following result:
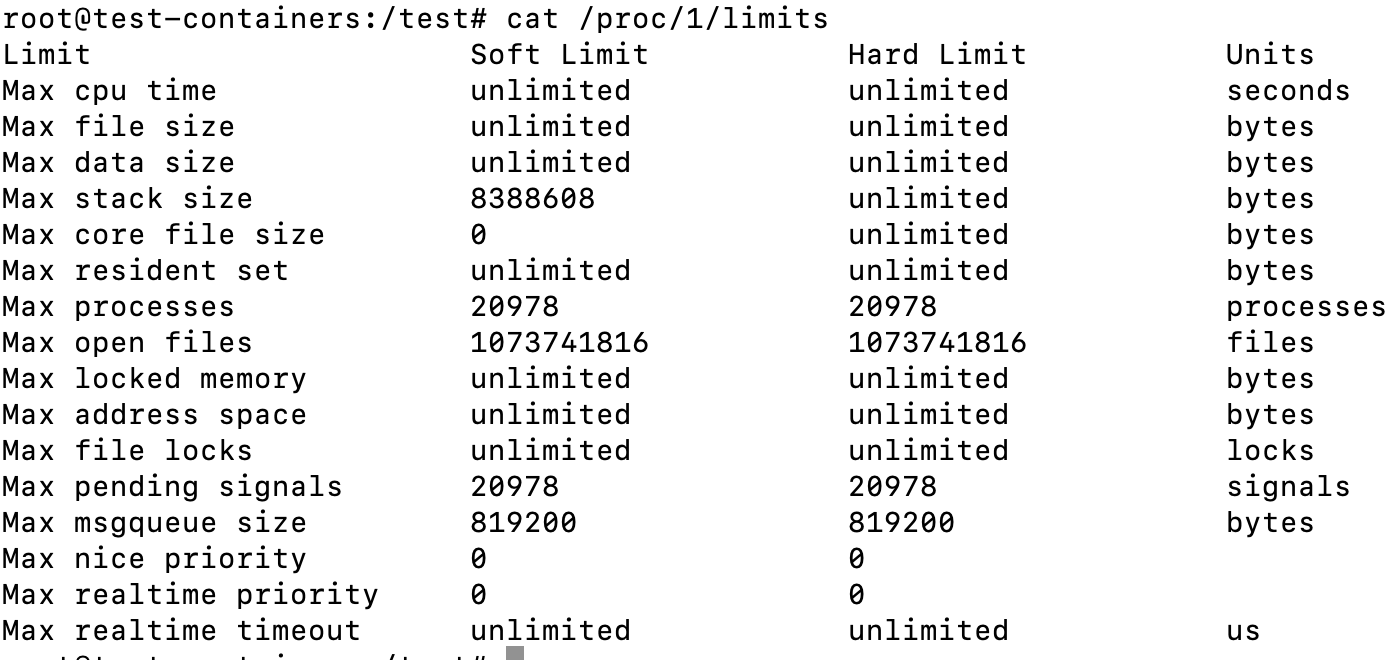
Aside from the advantage of being to see the limits of various processes, the output is also nicer than the equivalent command ulimit -a:
Digging out Kernel information
I am not going to go too deeply into this section since this post is already rather long, but you can also find a wealth of information about it within the /proc directory, here are some examples.
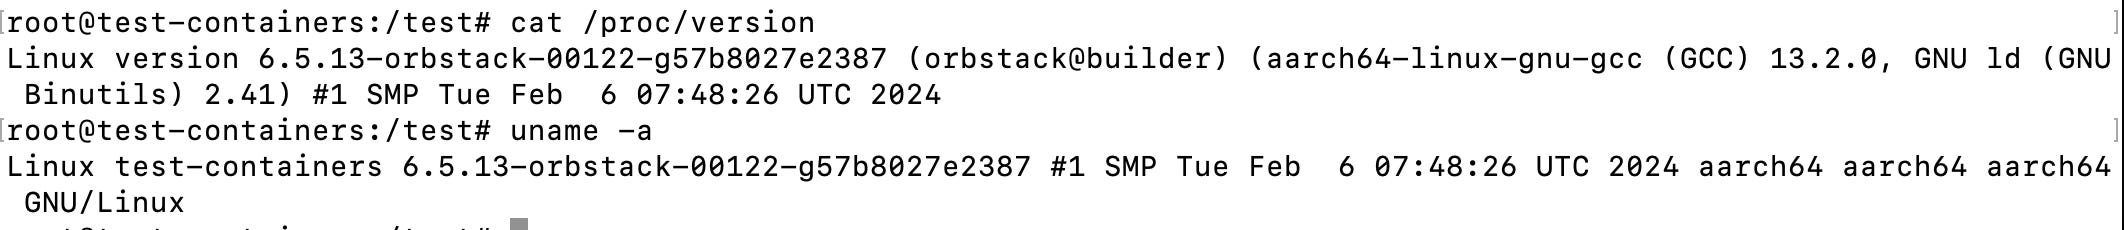
Getting version of the Kernel
Using cat /proc/version yields a very similar result to uname -a
Kernel settings from config.gz
You can get kernel configurations by running the following command:
zcat /proc/config.gz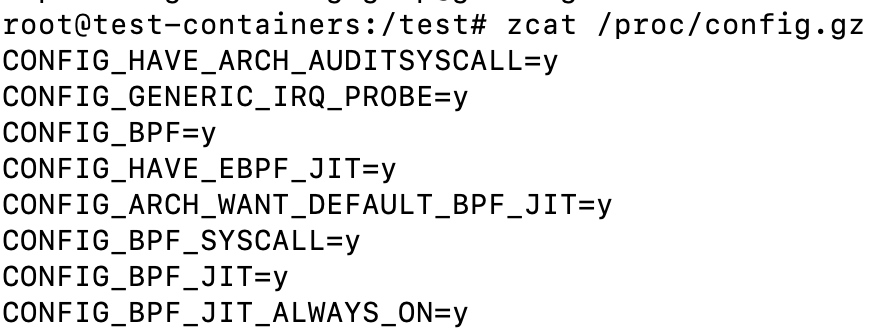
I haven’t gone very deeply into this, but it looks like it could be useful in some situations.
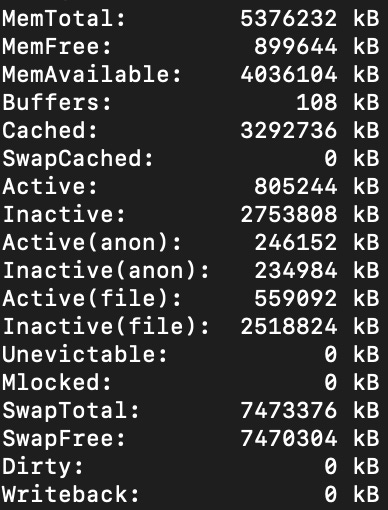
Memory info
We all know free -h but cat /proc/meminfo is pretty near too, yielding this and more:
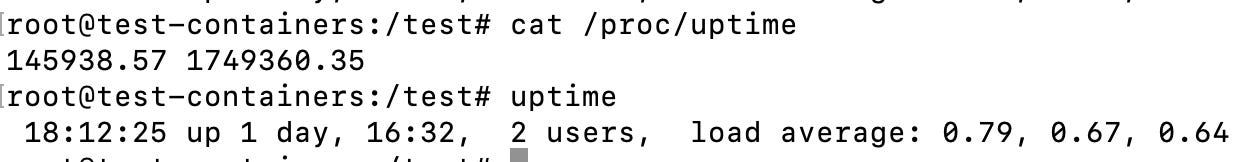
Uptime
You can also check the uptime of the computer with cat /proc/uptime but the output is in seconds, here is a comparison with with the uptime command
Conclusion
I really enjoyed taking this long detour into the world of the proc filesystem, it was a nice refresher and I learned much I didn’t know. This blog post is a remainder for me to take another tour at a later time and learn some more (the net folder and security implications are left for me to explore further), and also a note for me next time I am stuck inside a container without the right commands to query information about the system.
About me
Fernando Villalba has over a decade of miscellaneous IT experience. He started in IT support ("Have you tried turning it on and off?"), veered to become a SysAdmin ("Don't you dare turn it off") and later segued into DevOps type of roles ("Destroy and replace!"). He has been a consultant for various multi-billion dollar organizations helping them achieve their highest potential with their DevOps processes.
Friend, thank you so much! Very informative!
The only thing that didn't work was to mount the /proc file system to an arbitrary directory (Debian 12)
mount -t proc proc-mount-name /arbitrary-folder
column: proc: No such file or directory
column: proc-mount-name: No such file or directory
column: /arbitrary-folder: No such file or directory